Short Answer
TABLE 14-15
The superintendent of a school district wanted to predict the percentage of students passing a sixth-grade proficiency test.She obtained the data on percentage of students passing the proficiency test (% Passing),mean teacher salary in thousands of dollars (Salaries),and instructional spending per pupil in thousands of dollars (Spending)of 47 schools in the state.
Following is the multiple regression output with Y = % Passing as the dependent variable,X1 = Salaries and X2 = Spending: 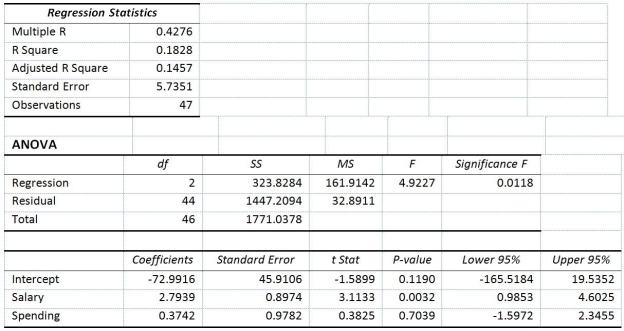
-Referring to Table 14-15,what are the lower and upper limits of the 95% confidence interval estimate for the effect of a one thousand dollar increase in instructional spending per pupil on the mean percentage of students passing the proficiency test?
Correct Answer:

Verified
-1.5972 (%...View Answer
Unlock this answer now
Get Access to more Verified Answers free of charge
Correct Answer:
Verified
View Answer
Unlock this answer now
Get Access to more Verified Answers free of charge
Q83: In a multiple regression model,the adjusted r
Q313: TABLE 14-8<br>A financial analyst wanted to examine
Q314: TABLE 14-4<br>A real estate builder wishes to
Q315: TABLE 14-16<br>What are the factors that determine
Q316: TABLE 14-17<br>Given below are results from the
Q318: TABLE 14-8<br>A financial analyst wanted to examine
Q319: TABLE 14-7<br>The department head of the accounting
Q320: TABLE 14-11<br>A weight-loss clinic wants to use
Q321: TABLE 14-4<br>A real estate builder wishes to
Q322: TABLE 14-7<br>The department head of the accounting