Multiple Choice
TABLE 14-17
Given below are results from the regression analysis where the dependent variable is the number of weeks a worker is unemployed due to a layoff (Unemploy) and the independent variables are the age of the worker (Age) and a dummy variable for management position (Manager: 1 = yes,0 = no) .
The results of the regression analysis are given below: 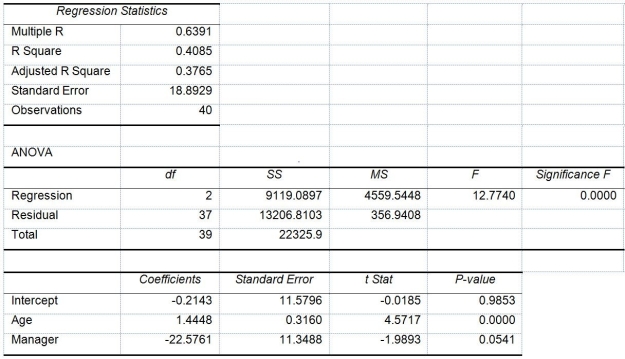
-Referring to Table 14-17,which of the following is a correct statement?
A) 40.85% of the total variation in the number of weeks a worker is unemployed due to a layoff can be explained by the age of the worker and whether the worker is a manager.
B) 40.85% of the total variation in the number of weeks a worker is unemployed due to a layoff can be explained by the age of the worker and whether the worker is a manager after adjusting for the number of predictors and sample size.
C) 40.85% of the total variation in the number of weeks a worker is unemployed due to a layoff can be explained by the age of the worker and whether the worker is a manager after adjusting for the level of significance.
D) 40.85% of the total variation in the number of weeks a worker is unemployed due to a layoff can be explained by the age of the worker and whether the worker is a manager holding constant the effect of all the independent variables.
Correct Answer:

Verified
Correct Answer:
Verified
Q44: TABLE 14-15<br>The superintendent of a school district
Q45: TABLE 14-8<br>A financial analyst wanted to examine
Q46: TABLE 14-15<br>The superintendent of a school district
Q47: TABLE 14-8<br>A financial analyst wanted to examine
Q50: TABLE 14-18<br>A logistic regression model was estimated
Q51: TABLE 14-7<br>The department head of the accounting
Q52: TABLE 14-4<br>A real estate builder wishes to
Q53: TABLE 14-4<br>A real estate builder wishes to
Q54: TABLE 14-8<br>A financial analyst wanted to examine
Q82: True or False: The coefficient of multiple