Multiple Choice
TABLE 14-17
Given below are results from the regression analysis where the dependent variable is the number of weeks a worker is unemployed due to a layoff (Unemploy) and the independent variables are the age of the worker (Age) and a dummy variable for management position (Manager: 1 = yes,0 = no) .
The results of the regression analysis are given below: 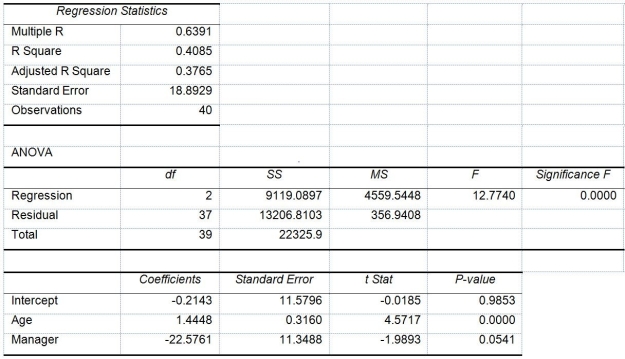
-Referring to Table 14-17,which of the following is the correct alternative hypothesis to determine whether there is a significant relationship between percentage of students passing the proficiency test and the entire set of explanatory variables?
A) H1 : All βj ≠ 0 for j = 0,1,2
B) H1 : All βj ≠ 0 for j = 1,2
C) H1 : At least one of βj ≠ 0 for j = 0,1,2
D) H1 : At least one of βj ≠ 0 for j = 1,2
Correct Answer:

Verified
Correct Answer:
Verified
Q5: True or False: The interpretation of the
Q11: True or False: A regression had the
Q67: True or False: If you have taken
Q173: A dummy variable is used as an
Q242: TABLE 14-10<br>You worked as an intern at
Q255: TABLE 14-17<br>Given below are results from the
Q256: TABLE 14-19<br>The marketing manager for a nationally
Q257: TABLE 14-17<br>Given below are results from the
Q258: TABLE 14-6<br>One of the most common questions
Q261: TABLE 14-17<br>Given below are results from the