Short Answer
TABLE 14-17
Given below are results from the regression analysis where the dependent variable is the number of weeks a worker is unemployed due to a layoff (Unemploy)and the independent variables are the age of the worker (Age)and a dummy variable for management position (Manager: 1 = yes,0 = no).
The results of the regression analysis are given below: 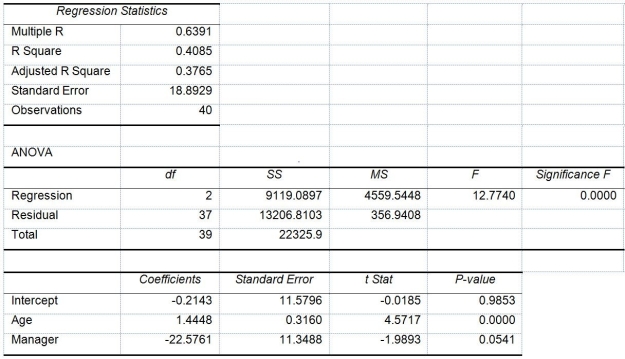
-Referring to Table 14-17,what are the lower and upper limits of the 95% confidence interval estimate for the difference in the mean number of weeks a worker is unemployed due to a layoff between a worker who is in a management position and one who is not after taking into consideration the effect of all the other independent variables?
Correct Answer:

Verified
Correct Answer:
Verified
Q94: TABLE 14-10<br>You worked as an intern at
Q148: TABLE 14-5<br>A microeconomist wants to determine how
Q239: TABLE 14-11<br>A weight-loss clinic wants to use
Q240: TABLE 14-17<br>Given below are results from the
Q241: TABLE 14-15<br>The superintendent of a school district
Q243: TABLE 14-16<br>What are the factors that determine
Q247: TABLE 14-7<br>The department head of the accounting
Q248: TABLE 14-16<br>What are the factors that determine
Q249: TABLE 14-18<br>A logistic regression model was estimated
Q300: TABLE 14-8<br>A financial analyst wanted to examine