Short Answer
TABLE 2-9
The frequency distribution below represents the rents of 250 randomly selected federally subsidized apartments in a small town. 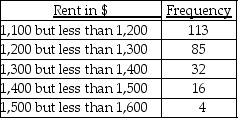
-Referring to Table 2-9,________ apartments rented for at least $1,200 but less than $1,400.
Correct Answer:

Verified
Correct Answer:
Verified
Q5: TABLE 2-10<br>The histogram below represents scores achieved
Q12: TABLE 2-9<br>The frequency distribution below represents the
Q16: TABLE 2-14<br>The table below contains the number
Q19: Which descriptive summary measures are considered to
Q128: TABLE 2-10<br>The histogram below represents scores achieved
Q129: TABLE 2-12<br>The table below contains the opinions
Q144: TABLE 2-8<br>The Stem-and-Leaf display represents the number
Q175: TABLE 2-8<br>The Stem-and-Leaf display represents the number
Q180: TABLE 2-6<br>A sample of 200 students at
Q210: TABLE 2-9<br>The frequency distribution below represents the