True/False
TABLE 2-18
The stem-and-leaf display below shows the result of a survey of 50 students on their satisfaction with their school,with the higher scores representing a higher level of satisfaction. 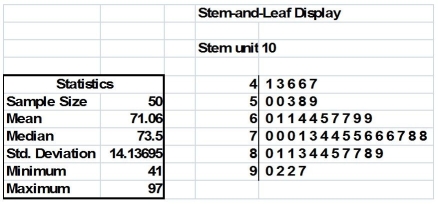
-True or False: Given below is the scatter plot of the number of employees and the total revenue (millions$)of 20 U.S.companies.There appears to be a positive relationship between total revenue and the number of employees. 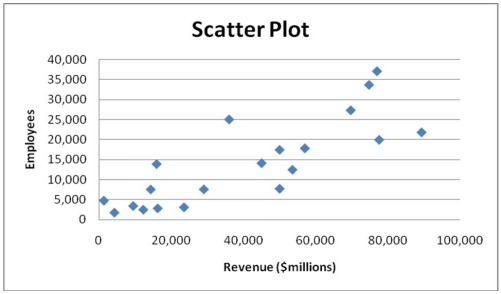
Correct Answer:

Verified
Correct Answer:
Verified
Q9: To determine the width of class interval,divide
Q21: TABLE 2-6<br>A sample of 200 students at
Q23: True or False: An ogive is a
Q60: TABLE 2-10<br>The histogram below represents scores achieved
Q68: TABLE 2-7<br>The Stem-and-Leaf display below contains data
Q98: TABLE 2-14<br>The table below contains the number
Q122: TABLE 2-12<br>The table below contains the opinions
Q149: Relationships in a contingency table can be
Q168: True or False: The main principle behind
Q190: TABLE 2-12<br>The table below contains the opinions