Multiple Choice
The diagram shows the graphic data from a CO2 response test.On the basis of the gross change,what physiologic response do these data represent? 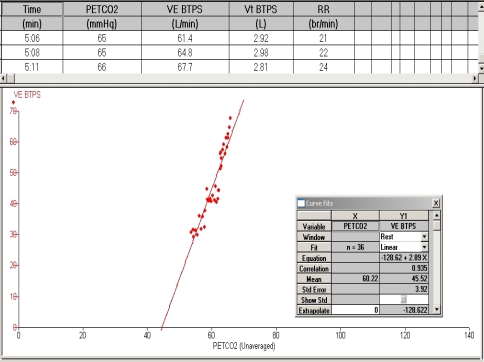
A) Blunted CO2 response
B) 3.5 L/min/mm Hg
C) Normal response
D) 0.5 L/min/mm Hg
Correct Answer:

Verified
Correct Answer:
Verified
Related Questions
Q8: A subject's tidal breathing is measured
Q9: A patient with COPD has the following
Q10: Exhaled gas is collected for 5 minutes;the
Q11: All of the following would cause an
Q12: Which of the following parameters should be
Q14: When preparing for a CO<sub>2</sub> response test,the
Q15: What is the calculated V<sub>D</sub>/V<sub>T</sub> ratio,given the
Q16: P<sub>100</sub> is the:<br>A) Ventilation in liters per
Q17: Which of the following tests requires a
Q18: A subject has the following data recorded