Essay
Samples Production
25 samples of size 4 were taken from a manufacturing process.The mean of the sample means and the pooled standard deviation are ,and S = 3.5,respectively.The sample means are listed below.
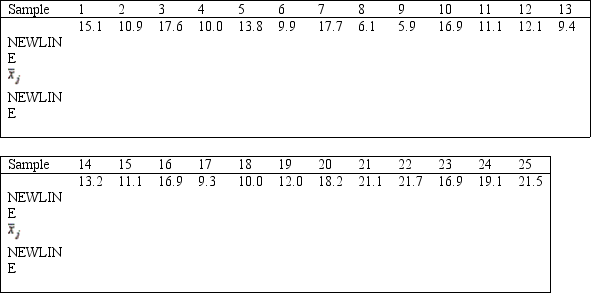
-{25 Samples Production Narrative} Find the centerline and control limits for the chart.
Correct Answer:

Verified
Correct Answer:
Verified
Q31: Which of the following elements affects the
Q34: Chance variation _ product quality and _
Q46: The process capability index measures the capability
Q88: Assume that the control limits of
Q89: For an <span class="ql-formula" data-value="\bar
Q90: Samples Production<br>Thirty samples of size 4
Q92: Samples Production<br>Thirty samples of size 4
Q94: A production facility produces 75 units
Q96: An <span class="ql-formula" data-value="\bar {
Q124: What are the null and alternative hypotheses