Short Answer
Diaper Delivery
Wrap-M-Up,a Ft.Lauderdale diaper Service,has 10 delivery men who each deliver diapers to 50 customers every day.Wrap-M-Up decides to record the proportion of diapers delivered on time for a 10-day period and construct a p chart to see whether the proportion is too erratic.The data are shown below: 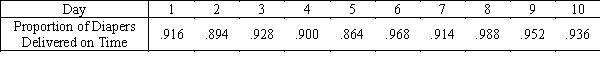
-{Diaper Delivery Narrative} Find the numerical value of the lower control limit for the p chart.
Correct Answer:

Verified
Correct Answer:
Verified
Q36: Assignable variation is caused by specific events
Q37: 25 Samples Production <br>25 samples of size
Q38: A trend indicates there is a slow
Q39: To determine whether the process distribution standard
Q40: Control charts for variables are appropriate whenever
Q42: Describe the three essential parts of a
Q43: Which of the following process results indicate
Q44: When the <img src="https://d2lvgg3v3hfg70.cloudfront.net/TB4388/.jpg" alt="When the
Q45: The mean of the sample means and
Q46: The process capability index measures the capability