menu-iconExamlexExamLexServices

Discover

Ask a Question
  1. All Topics
  2. Topic
    Statistics
  3. Study Set
    Statistics for Management and Economics Study Set 1
  4. Exam
    Exam 3: Graphical Descriptive Techniques II
  5. Question
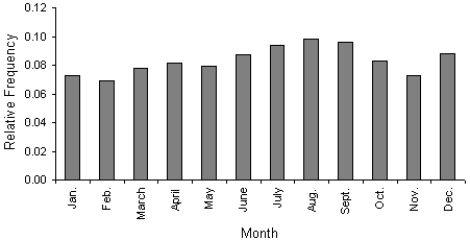
    The Graph Below Is an Example of a Histogram
Solved

The Graph Below Is an Example of a Histogram

Question 175

Question 175

True/False

The graph below is an example of a histogram. The graph below is an example of a histogram.

Correct Answer:

verifed

Verified

Unlock this answer now
Get Access to more Verified Answers free of charge

Related Questions

Q13: A line chart that is flat shows

Q45: Time series data are often graphically depicted

Q59: Graphical excellence gives the greatest number of

Q63: Which of the following statements about shapes

Q72: A popular method of creating distorted impressions

Q78: Credit Hours The College of Business at

Q119: Pie charts only show _,not _.This means

Q142: Which of the following statements about histograms

Q148: A bar chart can be made to

Q176: Test scores<br>The scores on a calculus
Examlex

ExamLex

About UsContact UsPerks CenterHomeschoolingTest Prep

Work With Us

Campus RepresentativeInfluencers

Links

FaqPricingChrome Extension

Download The App

Get App StoreGet Google Play

Policies

Privacy PolicyTerms of ServiceHonor CodeCommunity Guidelines

Scan To Download

qr-code

Copyright © (2025) ExamLex LLC.

Privacy PolicyTerms Of ServiceHonor CodeCommunity Guidelines