Multiple Choice
What type of graph depicts the data below? 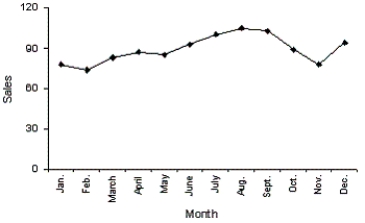
A) A line chart
B) A histogram
C) A dot plot
D) A bar chart
Correct Answer:

Verified
Correct Answer:
Verified
Related Questions
Q15: Which of the following describes a positive
Q37: The two most important characteristics to look
Q48: Compare the two histograms below.Which statement is
Q55: {Test Grades Narrative} Construct frequency and relative
Q57: According to the stem-and-leaf plot below,the
Q92: Electronics Company At a meeting of
Q109: The graphical technique used to describe the
Q133: It is speculated that the number of
Q144: In applications involving two variables,X and Y,where
Q156: The two most important characteristics revealed by