Multiple Choice
Which of the following statements describe(s) the line chart below? 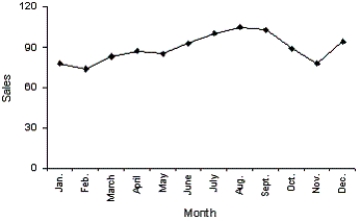
A) November experienced the lowest sales throughout the year.
B) August experienced the highest sales throughout the year.
C) Sales did not fluctuate more than 30 units on either side of 90.
D) All of these choices are true.
Correct Answer:

Verified
Correct Answer:
Verified
Q15: Which of the following describes a positive
Q19: Home Care Data are collected on
Q57: According to the stem-and-leaf plot below,the
Q62: Test scores<br>The scores on a calculus
Q63: Which of the following is true about
Q64: A cumulative relative frequency distribution lists the
Q65: Electronics Company<br>At a meeting of regional
Q81: The techniques of shrinking the horizontal axis
Q106: Thirty voters participating in a recent election
Q156: The two most important characteristics revealed by