Essay
The line chart below shows potato prices per pound for each month from January (month 1)to December last year.By looking at this chart you can see the lowest potato prices occurred in ____________________. 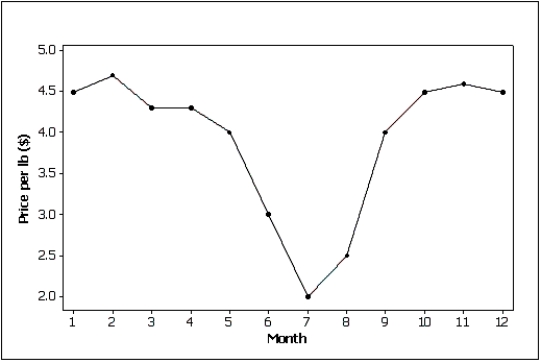
Correct Answer:

Verified
Correct Answer:
Verified
Related Questions
Q16: The number of observations within each class
Q33: A relative frequency distribution describes the proportion
Q54: Which of the following represents time-series data?<br>A)The
Q77: The two most important characteristics to examine
Q83: A modal class in a histogram is
Q85: The graph below represents a line graph.
Q88: Internet Classes<br>A survey of 25 students
Q89: Teachers Ages<br>The ages (in years)of a
Q91: A department store's monthly sales (in
Q97: Home Care Data are collected on