Essay
Credit Hours
The College of Business at The State University of California produced 3,400 credit hours during Spring Semester,2011he number and percentage of credit hours produced by each of the four departments in the College of Business is shown below.
The following three-dimensional pie chart was constructed from the table above. 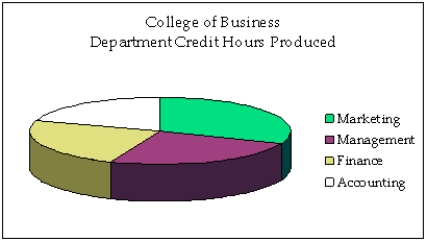
-Briefly explain why the histogram below is misleading. 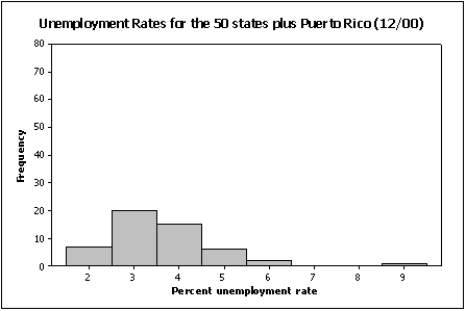
Correct Answer:

Verified
The scale on the Y-axis has be...View Answer
Unlock this answer now
Get Access to more Verified Answers free of charge
Correct Answer:
Verified
View Answer
Unlock this answer now
Get Access to more Verified Answers free of charge
Q12: Insurance Company A representative from a local
Q13: The length of each line in a
Q16: Compare the two histograms below.Which statement is
Q18: <img src="https://d2lvgg3v3hfg70.cloudfront.net/TB4388/.jpg" alt=" Admission to ER
Q42: Possible methods of graphical deception include:<br>A)A graph
Q61: A histogram is said to be symmetric
Q65: Credit Hours The College of Business at
Q100: The scale used on a bar chart
Q120: Which of the following represents a graphical
Q146: If when one variable increases the other