Multiple Choice
The bar charts below summarize data collected on 100 adults regarding gender and pet ownership.Which of the following statements is (are) true based on this chart? 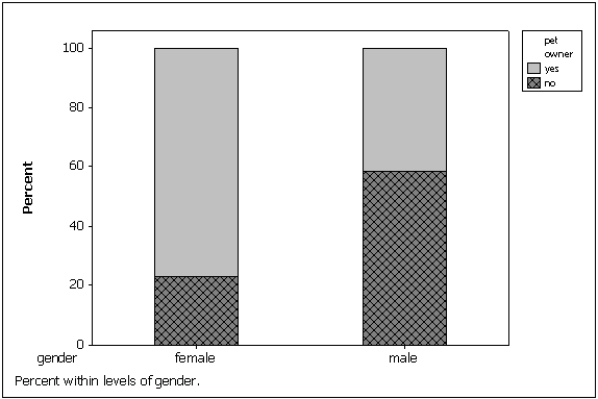
A) Gender and pet ownership are related;a higher percentage of males own pets than females.
B) Gender and pet ownership are related;a higher percentage of females own pets than males.
C) Gender and pet ownership are related;males and females own the same percentage of pets.
D) Gender and pet ownership are not related.
Correct Answer:

Verified
Correct Answer:
Verified
Q16: One of the advantages of a pie
Q25: Bar and pie charts are graphical techniques
Q26: Explain the difference between ordinal data and
Q35: Using the following cross-classification table,draw two
Q39: Using the following cross-classification table,draw two
Q41: A college professor classifies his students
Q56: Your final grade in a course (A,B,C,D,E)is
Q69: {All-Nighter Narrative} Of those who stayed up
Q87: A(n)_ chart is often used to display
Q89: In purchasing an automobile,there are a number