Multiple Choice
A random sample of 30 executives from companies with assets over $1 million was selected and asked for their annual income and level of education.The ANOVA comparing the average income among three levels of education rejected the null hypothesis.The Mean Square Error (MSE) was 243.7.The following table summarized the results: 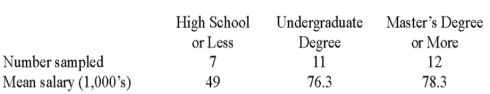 Based on the comparison between the mean annual incomes for executives with Undergraduate and Master's Degree or more,
A) A confidence interval shows that the mean annual incomes are not significantly different.
B) The ANOVA results show that the mean annual incomes are significantly different.
C) A confidence interval shows that the mean annual incomes are significantly different.
D) The ANOVA results show that the mean annual incomes are not significantly different.
Correct Answer:

Verified
Correct Answer:
Verified
Q38: When testing for differences between treatment means,the
Q45: Two accounting professors decided to compare the
Q46: A manufacturer of automobile transmissions uses three
Q49: A random sample of 40 companies with
Q51: A random sample of 40 companies
Q52: Two accounting professors decided to compare the
Q53: A manufacturer of automobile transmissions uses three
Q54: Two accounting professors decided to compare the
Q60: An F-statistic is _.<br>A)a ratio of two
Q127: When H<sub>0</sub> is rejected in ANOVA, _