Multiple Choice
A random sample of 40 companies with assets over $10 million was selected and asked for their annual computer technology expense and industry.The ANOVA comparing the average computer technology expense among three industries rejected the null hypothesis.The Mean Square Error (MSE) was 195.The following table summarized the results: 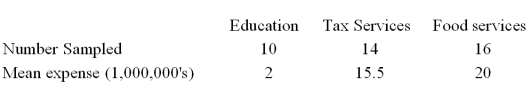 Based on the comparison between the mean computer technology expense for companies in the Education and Tax services industries,
A) A confidence interval shows that the mean annual computer technology expenses are not significantly different.
B) The ANOVA results show that the mean annual computer technology expenses are significantly different.
C) A confidence interval shows that the mean annual computer technology expenses are significantly different.
D) The ANOVA results show that the mean annual computer technology expenses are not significantly different.
Correct Answer:

Verified
Correct Answer:
Verified
Q15: A large department store examined a sample
Q25: Given the following Analysis of Variance table
Q27: Several employees have submitted different methods of
Q28: Like Student's t distribution,a change in the
Q31: An electronics company wants to compare the
Q33: For the hypothesis test, <img src="https://d2lvgg3v3hfg70.cloudfront.net/TB7522/.jpg" alt="For
Q35: In ANOVA,an F statistic is used to
Q62: What test statistic is used to compare
Q65: When testing for differences between treatment means,
Q86: In an one-way ANOVA, how many degrees