Multiple Choice
The age distribution of a sample of part-time employees at Lloyd's Fast Food Emporium is: 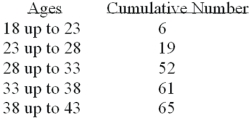 What type of chart should be drawn to present this data?
A) Histogram
B) Simple line chart
C) Cumulative Frequency Distribution
D) Pie chart
E) Frequency polygon
Correct Answer:

Verified
Correct Answer:
Verified
Q16: Refer to the following distribution: <img src="https://d2lvgg3v3hfg70.cloudfront.net/TB7522/.jpg"
Q17: A group of 100 students were surveyed
Q21: A relative frequency distribution shows the number
Q22: Draw a bar graph that illustrates the
Q23: For quantitative data,the relative frequency for a
Q25: Refer to the following distribution of commissions:
Q60: What is the number of observations in
Q67: A frequency distribution for qualitative data has
Q103: When classes in a frequency table are
Q127: Refer to the following information from a