Multiple Choice
Refer to the following distribution of commissions: 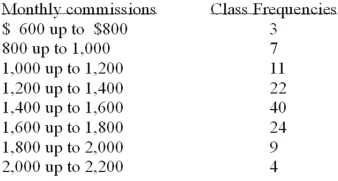 The first plot for a cumulative frequency distribution would be:
A) X = 0,Y = 600.
B) X = 600,Y = 3.
C) X = 3,Y = 600.
D) X = 600,Y = 0.
Correct Answer:

Verified
Correct Answer:
Verified
Related Questions
Q13: A pie chart is similar to a
Q19: A cumulative frequency distribution is used when
Q30: To summarize the gender of students attending
Q31: When data is collected using a qualitative,nominal
Q33: A sample distribution of hourly earnings in
Q40: To summarize the gender of students attending
Q77: To convert a frequency distribution to a
Q105: When data is collected using a quantitative,
Q115: A student was studying the political party
Q120: Why are unequal class intervals sometimes used