Multiple Choice
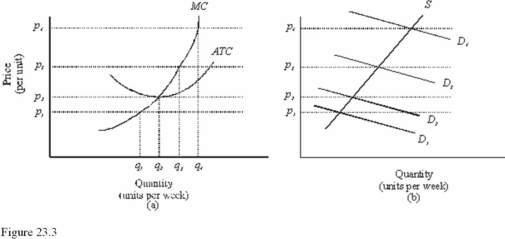 In Figure 23.3, diagram "a" presents the cost curves that are relevant to a firm's production decision, and diagram "b" shows the market demand and supply curves for the market. Use both diagrams to answer the following question: In Figure 23.3, if market demand is at D1, the firm should
A) Leave the market.
B) Produce q1.
C) Shut down.
D) Do any of the above depending on the position of the AVC and the length of the time period.
Correct Answer:

Verified
Correct Answer:
Verified
Q5: The equilibrium price in a competitive market<br>A)
Q18: Which characteristic of competitive markets permits society
Q18: One In the News article "IBM Forced
Q62: Technological improvements cause<br>A)New firms to enter but
Q63: The entry of firms into a market,ceteris
Q69: As long as an economic profit is
Q78: <img src="https://d2lvgg3v3hfg70.cloudfront.net/TB5717/.jpg" alt=" If the firm
Q80: <img src="https://d2lvgg3v3hfg70.cloudfront.net/TB5717/.jpg" alt=" Refer to Figure
Q133: If long-run economic losses are being experienced
Q150: The decision by firms to enter a