Multiple Choice
Use the figure below to answer the following question.
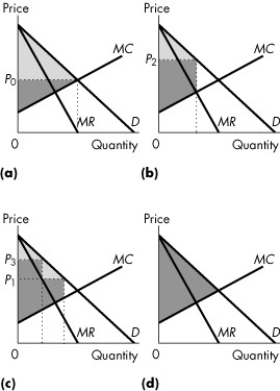
Figure 13.4.4
-Refer to Figure 13.4.4. Consider a market with a perfect price-discriminating monopolist. If the light grey area shows the consumer surplus and the dark grey area shows the producer surplus, which graph correctly represents this firm?
A) (a)
B) (b)
C) (c)
D) (d)
E) none of the graphs
Correct Answer:

Verified
Correct Answer:
Verified
Q31: Use the figure below to answer the
Q33: A monopolist under rate of return regulation
Q34: Consumer surplus is<br>A)positive in the case of
Q35: Use the information below to answer the
Q39: Use the figure below to answer the
Q40: Use the figure below to answer the
Q41: Use the table below to answer the
Q52: A perfect price-discriminating monopoly is<br>A)less efficient than
Q57: Regulation of a natural monopoly will maximize
Q78: Social interest theory predicts that the political