Multiple Choice
Use the figure below to answer the following question.
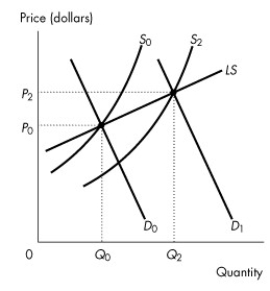 Figure 12.5.1
-Refer to Figure 12.5.1.Given the increase in market demand from D0 to D1,the graph represents
A) a constant cost industry.
B) an increasing cost industry.
C) a decreasing cost industry.
D) an inefficient market.
E) a market experiencing a technological change.
Correct Answer:

Verified
Correct Answer:
Verified
Q1: A perfectly competitive firm's supply curve includes
Q11: Which one of the following does not
Q29: A firm maximizes profit by producing the
Q31: Consumers choose _.<br>Consumers are efficient on the
Q41: Use the figure below to answer the
Q47: Use the table below to answer the
Q75: A firm in a perfectly competitive industry
Q78: Use the figure below to answer the
Q84: Use the table below to answer the
Q109: The shutdown point occurs at the point