Multiple Choice
Use the figure below to answer the following question.
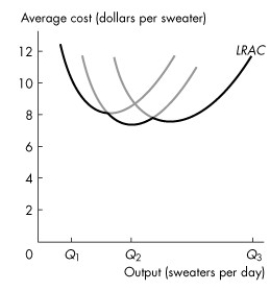 Figure 11.4.3
-Refer to Figure 11.4.3 which shows a firm's long-run average total cost curve.An increase in production from Q1 to Q2 sweaters per day produces
A) the minimum efficient scale.
B) economies of scale.
C) diseconomies of scale.
D) constant total costs.
E) constant returns to scale.
Correct Answer:

Verified
Correct Answer:
Verified
Q14: Marginal cost equals<br>A)TC/Q.<br>B)Q/TVC.<br>C)(TC - TVC)/Q.<br>D)TC/ΔQ.<br>E)ΔTC/ΔQ.
Q59: Diminishing returns to capital _ occur as
Q76: Which one of the following statements is
Q78: Which of the following quotes best illustrates
Q83: Average variable cost is at a minimum
Q84: The total product curve is a graph
Q101: Use the figure below to answer the
Q123: Suppose Honda can triple its production of
Q136: If AFC is falling then MC must
Q142: Which one of the following statements is