Multiple Choice
Use the figure below to answer the following questions.
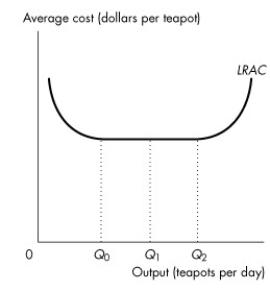 Figure 11.4.4
-Refer to Figure 11.4.4,which illustrates the long-run average total cost curve.Which one of the following statements is false?
A) Economies of scale exist between 0 and Q0 units of output.
B) Diseconomies of scale exist between 0 and Q1 units of output.
C) Constant returns to scale exist between Q1 and Q2 units of output.
D) Diseconomies of scale exist at quantities greater than Q2 units of output.
E) Constant returns to scale exist between Q0 and Q1 units of output.
Correct Answer:

Verified
Correct Answer:
Verified
Q38: Marginal cost<br>A)is constantly increasing,but as output increases
Q42: Use the figure below to answer the
Q55: Which of the following statements by a
Q58: The long-run average cost curve is the
Q63: The average variable cost curve will shift
Q64: The marginal product of capital is the<br>A)change
Q89: The average product of labour is<br>A)the inverse
Q96: If capital is a variable input in
Q101: The marginal product of labour initially _
Q128: When the marginal product of labour is