Multiple Choice
Use the figure below to answer the following question.
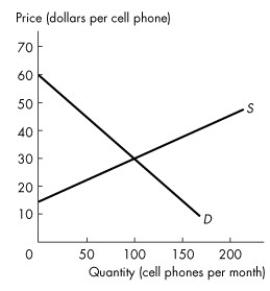
Figure 5.3.4
-Refer to Figure 5.3.4. The graph shows the market for cell phones. When production is efficient, total surplus is ________ and the cost of producing the cell phones sold is ________.
A) $2,250; $2,250
B) $2,250; $3,000
C) $1,500; $750
D) $750; $1,500
E) $1,500; $2,250
Correct Answer:

Verified
Correct Answer:
Verified
Q14: Use the table below to answer the
Q16: What is the producer surplus for the
Q40: Use the figure below to answer the
Q45: Use the figure below to answer the
Q65: Lotteries work best<br>A)under any circumstances.<br>B)under the first-come,first
Q101: Contests do a good job in resource
Q109: Charlene is willing to pay $5.00 for
Q111: In 2012, a severe drought led to
Q115: Use the table below to answer the
Q118: What is the consumer surplus for the