Multiple Choice
Use the figure below to answer the following question.
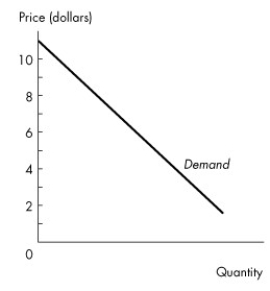
Figure 4.1.1
-Figure 4.1.1 illustrates a linear demand curve. Comparing the price elasticity in the $2 to $3 price range with the elasticity in the $8 to $9 range, we can conclude
A) that demand is more elastic in the $8 to $9 price range.
B) that demand is more elastic in the $2 to $3 price range.
C) that the price elasticity of demand is the same in both price ranges.
D) nothing without numerical information about quantities.
E) that the price elasticity of demand is zero in both price ranges because the demand curve is a straight-line demand curve.
Correct Answer:

Verified
Correct Answer:
Verified
Q2: If a 12 percent fall in price
Q25: If Saudi Arabia argues that an increase
Q97: If a turnip is an inferior good,
Q99: When the price of peanut butter rises
Q101: The price elasticity of demand is a
Q104: The price elasticity of demand for purses
Q105: If an increase in the supply of
Q106: Use the information below to answer the
Q107: Supply is inelastic if<br>A)a small percentage change
Q153: Use the figure below to answer the