Multiple Choice
Use the figure below to answer the following questions. 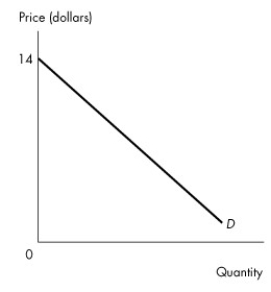 Figure 4.1.2
-Figure 4.1.2 illustrates a linear demand curve.If the price falls from $13 to $11,
A) total revenue increases.
B) total revenue decreases.
C) total revenue remains unchanged.
D) total revenue initially increases then decreases.
E) total revenue initially decreases then increases.
Correct Answer:

Verified
Correct Answer:
Verified
Q96: A negative value for<br>A)price elasticity of supply
Q97: For which one of the following will
Q98: Suppose your annual income is $65,000 and
Q99: All normal goods have<br>A)an income elasticity of
Q100: The price elasticity of demand depends on<br>A)the
Q102: With higher fuel costs,airlines raise their average
Q103: If the demand for good Z is
Q104: The cross elasticity of demand between Coca-Cola
Q105: Suppose the demand curve for good X
Q106: The price of gasoline rises by 25