Multiple Choice
Use the figure below to answer the following questions.
Table 3.5.2
Demand and Supply Schedules for Cups of Coffee each day at CoolU
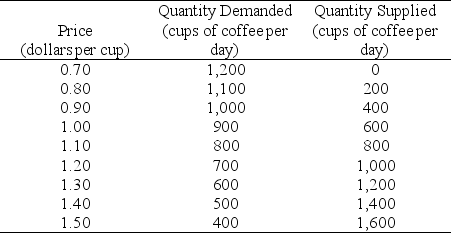
-Refer to Table 3.5.2.Professor Hyper publishes a new study,showing that coffee raises the test performance of students.Students double their demand for coffee.This change would be represented as a
A) leftward shift of the demand curve.
B) rightward shift of the demand curve.
C) leftward shift of the supply curve.
D) rightward shift of the supply curve.
E) movement up along the demand curve.
Correct Answer:

Verified
Correct Answer:
Verified
Q66: Use the figure below to answer the
Q67: People buy more of good 1 when
Q68: Use the table below to answer the
Q69: Which one of the following correctly describes
Q70: Which one of the following would lead
Q72: What will happen to the equilibrium price
Q73: The cost of producing aspirin increases at
Q74: Use the figure below to answer the
Q75: If we observe an increase in the
Q76: Consider a graph that shows an upward-sloping