Multiple Choice
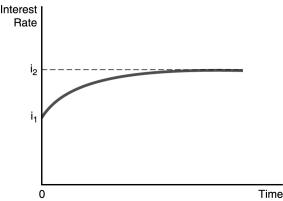
-The figure above illustrates the effect of an increased rate of money supply growth at time period 0. From the figure, one can conclude that the
A) liquidity effect is smaller than the expected inflation effect and interest rates adjust quickly to changes in expected inflation.
B) liquidity effect is larger than the expected inflation effect and interest rates adjust quickly to changes in expected inflation.
C) liquidity effect is larger than the expected inflation effect and interest rates adjust slowly to changes in expected inflation.
D) liquidity effect is smaller than the expected inflation effect and interest rates adjust slowly to changes in expected inflation.
Correct Answer:

Verified
Correct Answer:
Verified
Q15: In the loanable funds framework,the _ is
Q27: Milton Friedman called the response of lower
Q36: Using the liquidity preference framework,show what happens
Q43: Everything else held constant,when real estate prices
Q54: Factors that can cause the supply curve
Q73: A decline in the expected inflation rate
Q82: If people expect real estate prices to
Q131: The demand for Picasso paintings rises (holding
Q145: Of the four factors that influence asset
Q164: Everything else held constant,when bonds become less