Multiple Choice
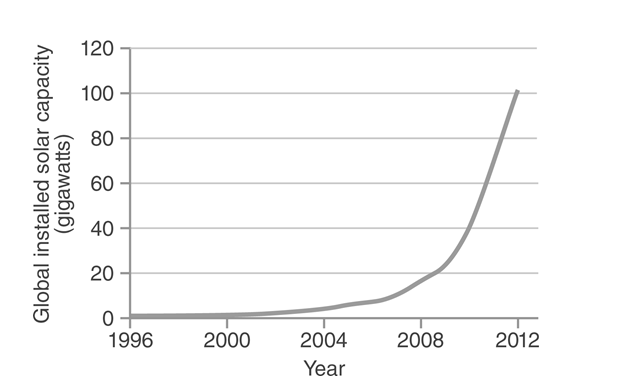
-According to the figure above,during which of the following periods did global installed solar capacity increase by the greatest percentage?
A) 2006 to 2010
B) 2008 to 2010
C) 2004 to 2006
D) 2010 to 2012
Correct Answer:

Verified
Correct Answer:
Verified
Related Questions
Q6: A home in Oklahoma is built into
Q7: Passive solar is used in the design
Q8: A geothermal heat pump can be used
Q9: Every winter morning when the sun is
Q10: One of the main motivations for using
Q12: Current photovoltaic technology uses sunlight to generate
Q13: An anode and a cathode are found
Q14: Coal would not be considered a renewable
Q15: Richie learned in his environmental science class
Q16: In the United States,the production of hydroelectricity_