Multiple Choice
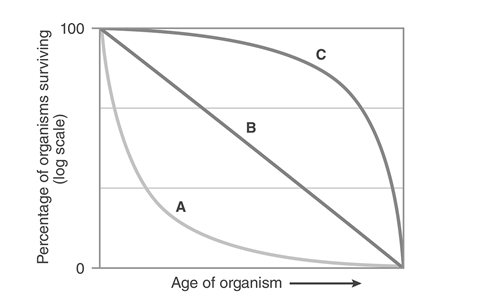
-Which survivorship curve in the figure depicts a species that has a high death rate early in life,followed by a period of low death rate early in adulthood,and then a period of high death rate later in life?
A) Line A
B) Line B
C) Line C
D) None of the above
Correct Answer:

Verified
Correct Answer:
Verified
Q16: Why is the sea otter considered a
Q17: Which of the following represents a type
Q18: Purple martins are the largest species of
Q19: Read the following scenario, and answer the
Q20: Read the following scenario, and answer the
Q22: Which of the following best illustrates resilience?<br>A)Soil
Q23: What makes up an ecological community?<br>A)All of
Q24: Which one of the following illustrates intraspecific
Q25: <img src="https://d2lvgg3v3hfg70.cloudfront.net/TB5135/.jpg" alt=" -Which line in
Q26: Flying squirrels competing with each other for