Multiple Choice
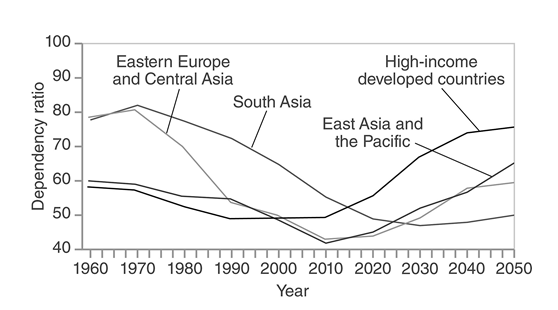
-Examine the dependency ratio trends for the regions in this figure.Which of the following best explains the recent increase in the dependency ratio in developed countries?
A) As per capita income rises,people marry at a younger age.
B) More people have to work to keep per capita incomes high.
C) Life spans are longer resulting in an increase in elderly citizens.
D) As per capita income rises,family size increases.
Correct Answer:

Verified
Correct Answer:
Verified
Q5: Which of the following factors would decrease
Q6: The world population growth rate is currently
Q7: <img src="https://d2lvgg3v3hfg70.cloudfront.net/TB5135/.jpg" alt=" -Which of the
Q8: <img src="https://d2lvgg3v3hfg70.cloudfront.net/TB5135/.jpg" alt=" -The age structure
Q11: <img src="https://d2lvgg3v3hfg70.cloudfront.net/TB5135/.jpg" alt=" -In this figure,the
Q12: The Green Revolution of the 20th century
Q13: A declining dependency ratio_ .<br>A)requires increased spending
Q14: <img src="https://d2lvgg3v3hfg70.cloudfront.net/TB5135/.jpg" alt=" -Which of the
Q15: A decline in a country's death rate
Q21: Briefly explain how the status of women