Multiple Choice
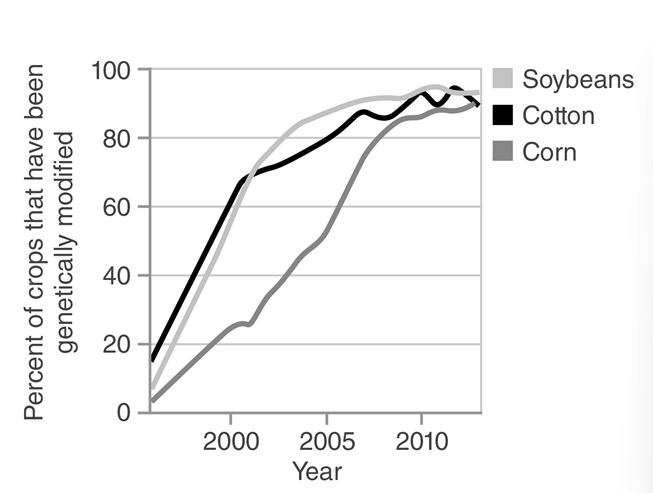
-Which of the following can be inferred from the information in the figure?
A) After rapid increases in the use of GMOs from 1995 to 2010,the percent of U.S.crops that are genetically modified has leveled off since 2010.
B) More bushels of genetically modified corn were produced in 2010 than soybeans.
C) Corn,cotton,and soybeans are the only genetically modified crops grown in the United States.
D) The use of genetically modified crops began in 1985.
Correct Answer:

Verified
Correct Answer:
Verified
Q3: Which of the following statements is true
Q4: Herbicides would be most useful in combating_
Q5: Explain the role of pollinators in agriculture,and
Q6: Roundup Ready corn is a transgenic crop
Q7: What commonly used pesticide caused declines in
Q9: Irrigation can result in the salinization of
Q10: Monoculture_ .<br>A)is a new development in agriculture
Q11: Although industrial agriculture has greatly reduced world
Q12: Many people in the developing world primarily
Q13: Which of the following is an integrated