Multiple Choice
Consider the following diagram, and then answer the question below.
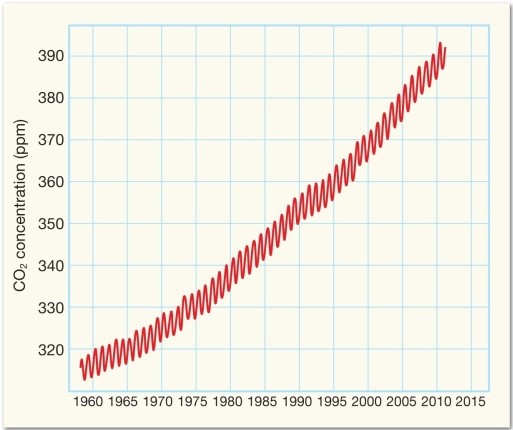
-What best explains the "bumps" seen in the seen in the CO2 concentrations on the graph above?
A) changes in plant growth that result in less CO2 being absorbed during the dormant season
B) a cyclic pattern in the eruption of volcanoes, causing more CO2 to be released each spring
C) greater amounts of CO2 released by the burning of fossil fuels for heat during the winter
D) higher levels of traffic producing more CO2 during the summer travel season
Correct Answer:

Verified
Correct Answer:
Verified
Q88: The four <i>thermal</i> layers of the atmosphere
Q89: Which of the following associations is CORRECT?<br>A)
Q90: Nearly all of planet Earth's mass is
Q91: With an INCREASE in altitude, air pressure:<br>A)
Q92: The tropopause is found where the air
Q94: Which of these is NOT a significant
Q95: Which one of the following gases has
Q96: The approximate altitude of auroral displays is:<br>A)
Q97: The least dense portion of the solid
Q98: Consider the following diagram, and then answer