Essay
The accompany diagram shows the market for gasoline,in which there are 1,000 consumers.Gasoline can be produced at a constant marginal cost of $2 per gallon.When the market is in equilibrium,the average consumer uses 15 gallons of gasoline per week. 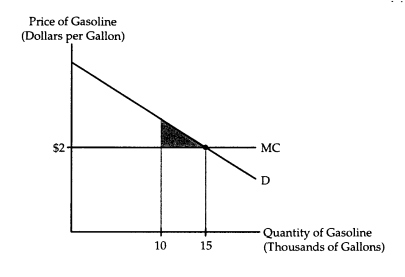 Suppose a war breaks out,temporarily limiting the amount of gasoline available for civilian use to 10,000 gallons per week.In the interest of fairness,the government allocates 10 gallons per week to each consumer,taxes each consumer $20 per week,and forbids barter in gasoline.Will the shaded area in the diagram accurately measure the loss in consumers' surplus? Why or why not?
Correct Answer:

Verified
The shaded area will underestimate the l...View Answer
Unlock this answer now
Get Access to more Verified Answers free of charge
Correct Answer:
Verified
View Answer
Unlock this answer now
Get Access to more Verified Answers free of charge
Q17: Recent evidence supports the belief that new
Q18: Under competition,the price of a resource reveals<br>A)
Q19: When allocation decision are not made on
Q20: The Fabian socialists argued that there would
Q21: The past performance of a stock is
Q23: A speculative bubble is characterized by systematic
Q24: Payments to a factor of production in
Q25: According to Hayek,a social planner has no
Q26: Employers may choose to pay efficiency wages
Q27: A draft is better for society because