Multiple Choice
The accompanying diagram shows the effect of levying an income tax on the consumer.The pre-tax optimum is at point A,and the post-tax optimum is at point B. 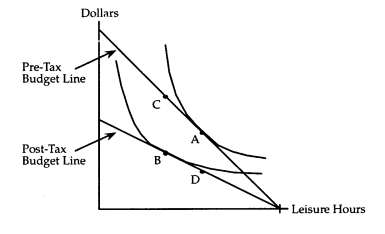 To measure the amount of tax money collected by the government,one uses the vertical distance between points
A) A and B.
B) A and D.
C) B and C.
D) B and D.
Correct Answer:

Verified
Correct Answer:
Verified
Related Questions
Q58: If Odetta's marginal value of freedom fries
Q59: Suppose leisure is on the horizontal axis
Q60: If a person is willing to trade
Q61: Consider an income tax and a head
Q62: Suppose a price index is formed to
Q64: Marginal value equals relative price at the
Q65: The price of wine has risen from
Q66: A consumer can not consume a basket
Q67: An indifference curve shows the baskets of
Q68: If the price of good X goes