Multiple Choice
Figure 1 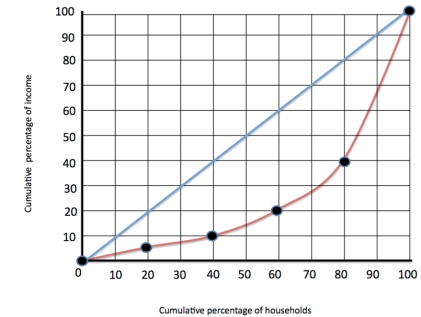
-Refer to figure 1. The red line refers to
A) The Gini coefficient
B) The Lorenz curve
C) The line of perfect inequality
D) The line of perfect equality
Correct Answer:

Verified
Correct Answer:
Verified
Related Questions
Q6: Assume that the government proposes a negative
Q7: Susan had a big win at the
Q8: A libertarian would be likely to argue
Q9: The maximin criterion suggested by John Rawls's
Q10: Current anti-poverty programs discourage work because<br>A) benefits
Q12: Because in-kind transfers are not accounted for
Q13: John Rawls's maximin criterion does not mean
Q15: Libertarians are more concerned with equal opportunity
Q16: John Rawls's suggestion that policy should be
Q148: The philosopher John Rawls argued that<br>A)people would