Multiple Choice
Refer to the figure below. This diagram represents the tobacco industry. The market creates an equilibrium price and quantity exchanged of 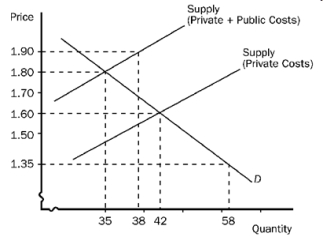
A) €1.90 and 38 units.
B) €1.80 and 35 units.
C) €1.60 and 42 units.
D) €1.35 and 58 units.
Correct Answer:

Verified
Correct Answer:
Verified
Q11: A negative externality (that has not been
Q13: Tax evasion is<br>A) Illegal and when finding
Q14: Tax avoidance is<br>A) Illegal when finding loopholes
Q15: Which best describes making political decisions to
Q17: A positive externality is an external benefit
Q18: For any given demand curve for pollution,
Q21: To internalize a positive externality, an appropriate
Q85: Use a graph to illustrate the quantity
Q114: Why are Pigovian taxes preferred to regulatory
Q183: The Coase theorem suggests that efficient solutions