Multiple Choice
Refer to the figure below. This diagram represents the tobacco industry. The socially optimal price and quantity exchanged are 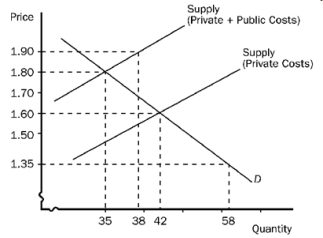
A) €1.90 and 38 units.
B) €1.80 and 35 units.
C) €1.60 and 42 units.
D) €1.35 and 58 units.
Correct Answer:

Verified
Correct Answer:
Verified
Related Questions
Q3: Internalizing an externality means<br>A) the good becomes
Q4: Because there are positive externalities from higher
Q5: Is it right to say that monetary
Q6: Which of the following is an example
Q7: If a market generates a positive externality,
Q9: A positive externality generates<br>A) a social cost
Q11: A negative externality (that has not been
Q13: Tax evasion is<br>A) Illegal and when finding
Q67: Using a supply and demand diagram, demonstrate
Q85: Use a graph to illustrate the quantity