Multiple Choice
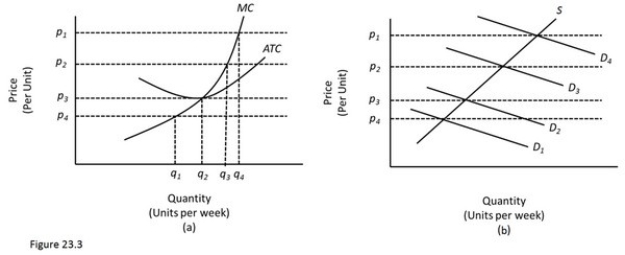 In Figure 23.3,diagram "a" presents the cost curves that are relevant to a firm's production decision,and diagram "b" shows the market demand and supply curves for the market.Use both diagrams to answer the following question: In Figure 23.3,the price at which a firm makes zero economic profits is
A) p1.
B) p2.
C) p3.
D) p4.
Correct Answer:

Verified
Correct Answer:
Verified
Q122: When an athletic shoe company is producing
Q123: The price consumers pay for a product
Q124: High profits in a particular industry indicate
Q125: If price is below the long-run competitive
Q126: Marginal cost pricing in competitive markets results
Q128: In a perfectly competitive market,when price is
Q129: <img src="https://d2lvgg3v3hfg70.cloudfront.net/TB5720/.jpg" alt=" Refer to Figure
Q130: Technological improvements cause<br>A)ATC to shift down.<br>B)The supply
Q131: If catfish farmers expect catfish prices to
Q132: Which of the following is not a