Multiple Choice
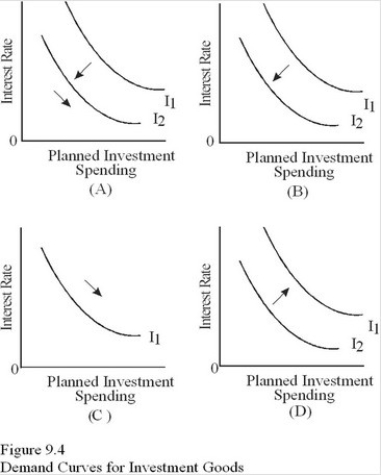 Which diagram in Figure 9.4 shows how investment responds to the expectation that the economy is about to go into a period of fast growth,causing firms to expect increased sales?
A) A.
B) B.
C) C.
D) D.
Correct Answer:

Verified
Correct Answer:
Verified
Q37: If the investment demand curve shifts to
Q38: The largest component of aggregate spending is
Q39: Autonomous consumption depends on all of the
Q40: Which of the following will cause an
Q41: The line described by the consumption function
Q43: Which of the following is not a
Q44: Dissaving occurs whenever<br>A)Current supply exceeds current production.<br>B)Current
Q45: <img src="https://d2lvgg3v3hfg70.cloudfront.net/TB5720/.jpg" alt=" Using Figure 9.1,the
Q46: Which of the following will cause an
Q47: According to Keynesian theory,which of the following