Multiple Choice
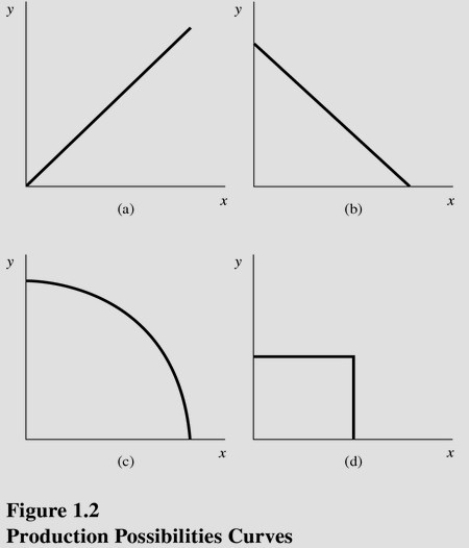 Choose the letter of the curve in Figure 1.2 that best represents a production possibilities curve for two goods that obey the law of increasing opportunity costs:
A) A.
B) B.
C) C.
D) D.
Correct Answer:

Verified
Correct Answer:
Verified
Related Questions
Q39: <img src="https://d2lvgg3v3hfg70.cloudfront.net/TB5720/.jpg" alt=" Using Figure 1.5,if
Q40: Government intervention may achieve a more optimal
Q41: If an economy is producing inside the
Q42: Which of the following events would allow
Q43: Table 1.1 shows the hypothetical trade-off
Q45: The invisible hand refers to<br>A)Intervention in the
Q46: The slope of a production possibilities curve
Q47: Table 1.1 shows the hypothetical trade-off
Q48: The fact that there are too few
Q49: Critics of government regulation argue that government