Multiple Choice
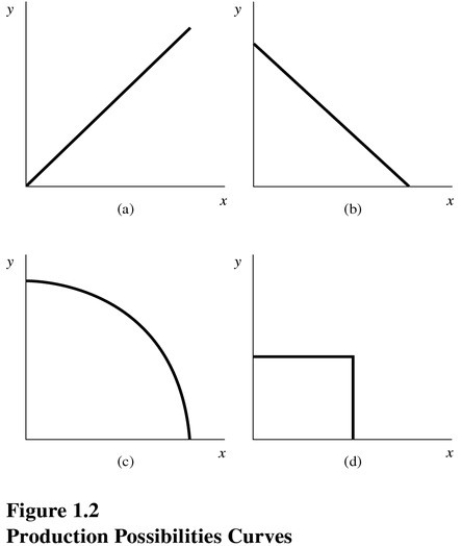 Choose the letter of the curve in Figure 1.2 that best represents a production possibilities curve for two goods for which there are constant opportunity costs:
A) A.
B) B.
C) C.
D) D.
Correct Answer:

Verified
Correct Answer:
Verified
Q27: Government failure occurs when government intervention fails
Q28: Table 1.3 shows the hypothetical trade-off
Q29: Table 1.1 shows the hypothetical trade-off
Q30: Describe the shape of the typical production
Q31: Economic models are used by economists to<br>A)Predict
Q33: All economies must make decisions concerning what
Q34: Macroeconomics focuses on the behavior of<br>A)Individual consumers.<br>B)Government
Q35: <img src="https://d2lvgg3v3hfg70.cloudfront.net/TB5720/.jpg" alt=" At which point
Q36: To calculate the slope of a line,find
Q37: In a market economy,the people who receive