Multiple Choice
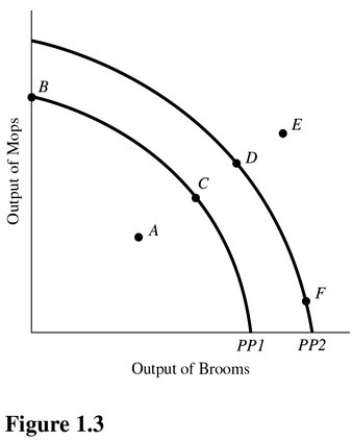 An increase in the proportion of the population that is unemployed above the normal rate is best represented in Figure 1.3 and using PP1 by a movement from point
A) C to point D.
B) D to point C.
C) C to point A.
D) E to point D.
Correct Answer:

Verified
Correct Answer:
Verified
Q6: Why do opportunity costs increase as society
Q7: <img src="https://d2lvgg3v3hfg70.cloudfront.net/TB5720/.jpg" alt=" Refer to Figure
Q8: <img src="https://d2lvgg3v3hfg70.cloudfront.net/TB5720/.jpg" alt=" Refer to Figure
Q9: Table 1.3 shows the hypothetical trade-off
Q10: <img src="https://d2lvgg3v3hfg70.cloudfront.net/TB5720/.jpg" alt=" Using Figure 1.3
Q12: <img src="https://d2lvgg3v3hfg70.cloudfront.net/TB5720/.jpg" alt=" At which point
Q13: If an economy experiences constant opportunity costs
Q14: <img src="https://d2lvgg3v3hfg70.cloudfront.net/TB5720/.jpg" alt=" Using Figure 1.6,if
Q15: Table 1.1 shows the hypothetical trade-off
Q16: Which of the following is not a