Multiple Choice
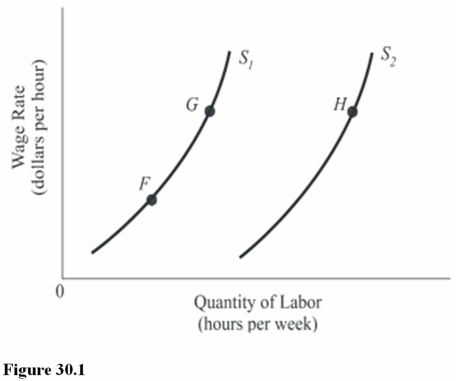
- In Figure 30.1,the shift in the labor supply curve from S1 to S2 means that
A) The marginal utility of labor has decreased.
B) Workers are being paid higher wage rates,given their taste for work.
C) The marginal utility of labor relative to leisure has increased.
Correct Answer:

Verified
Correct Answer:
Verified
Q58: The intersection of the labor market supply
Q69: The marginal revenue product establishes<br>A)An upper limit
Q71: Opportunity wage refers to the<br>A)Income an individual
Q72: A competitive firm should continue to hire
Q75: A production process is defined as<br>A)The manufacturing
Q77: According to the In The News article
Q78: Bill hates to work.He receives a great
Q79: If there is an increase in the
Q98: The substitution effect of wages explains shifts
Q99: If the MPP is declining,ceteris paribus,the MRP