Multiple Choice
Use the following figure to answer questions: Figure 1.4 1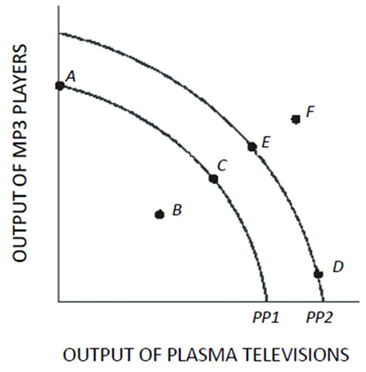
-In Figure 1.4,a shift of the production possibilities curve from PP1 to PP2 could be caused by
A) An increase in the unemployment rate.
B) Implementation of training programs that improve the skills of workers.
C) A flu epidemic that makes many workers sick.
D) Tougher pollution controls for the producers of plasma televisions and MP3 players.
Correct Answer:

Verified
Correct Answer:
Verified
Q1: Which of the following will cause the
Q2: Macroeconomics focuses on the performance of<br>A)Individual consumers.<br>B)Government
Q5: The doctrine of laissez faire is based
Q6: Table 1.2 shows the hypothetical trade-off between
Q7: Adam Smith's invisible hand is now called<br>A)Economic
Q9: Use the following figure to answer the
Q10: Which of the following can be used
Q11: Use the following figure to answer the
Q46: The slope of a production possibilities curve
Q114: Which of the following is an example