Multiple Choice
The image shown here could be used to construct 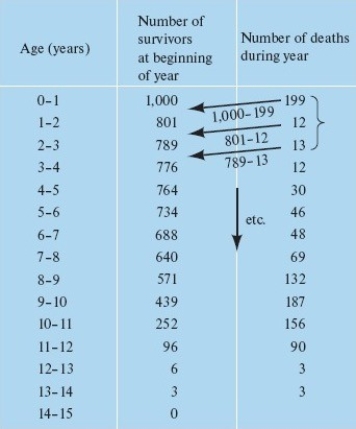
A) a cohort list.
B) a survivorship curve.
C) the pattern of survival.
D) the rate of dispersal.
Correct Answer:

Verified
Correct Answer:
Verified
Related Questions
Q1: Which of the following indicates a population
Q2: Which of the following are mismatched?<br>A) n<sub>x</sub>
Q4: Determine the size of a colony of
Q5: A group of subpopulations living in spatially
Q6: The "mean generation time" of a population
Q7: Fecundity is another term for the net
Q8: Type I survivorship curve indicates<br>A) low juvenile
Q9: The geometric rate of increase can be
Q10: The geometric rate of increase cannot be
Q11: The "net reproduction rate" equals<br>A) (∑x l<sub>x</sub>m<sub>x</sub>)/R<sub>0</sub>.<br>B)