Multiple Choice
A graph of class data is below. What is this type of graph called? 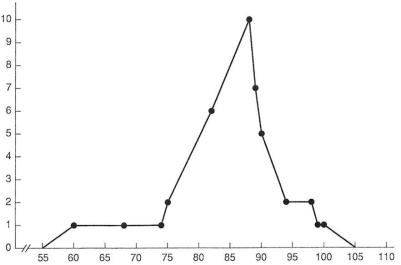
A) Frequency distribution
B) Normal distribution
C) Bell curve
D) Frequency polygon
Correct Answer:

Verified
Correct Answer:
Verified
Related Questions
Q15: What are the four steps required to
Q16: Organizing data to see how the data
Q17: What type of score is derived when
Q18: Using the data set below, answer the
Q19: What type of distribution is depicted below?
Q21: What type of distribution is depicted below?
Q22: What is the percentile rank that is
Q23: The mean, median, and mode make up
Q24: In a university, all students are given
Q25: The following set of data has what