Multiple Choice
Using the graph below, answer the questions that follow.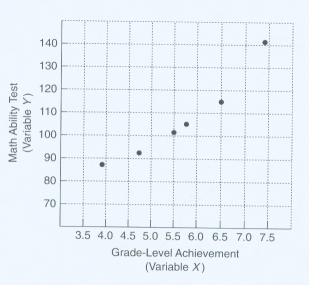
-Given the general flow of the direction of the data, these variables are likely to be which of the following?
A) Positively correlated
B) Negatively correlated
C) Possess no correlation
D) There is no way to tell correlation from visual interpretation of data.
Correct Answer:

Verified
Correct Answer:
Verified
Q38: The following sets of data are scores
Q39: Which type of reliability study may yield
Q40: Compare the reliability coefficient obtained by nine-year-olds
Q41: When a test measures what it was
Q42: What are the three types of reliability?
Q44: Educator is concerned with item reliability; items
Q45: One would expect that the number of
Q46: A teacher who administers a wide range
Q47: A new test was designed to measure
Q48: The scores obtained by Dr. Smith on