Essay
The graph below is the Keeling Curve,a record of carbon dioxide measured at Mauna Loa beginning in 1958.What can be learned from this graph? What do the two lines (black and grey)tell us? 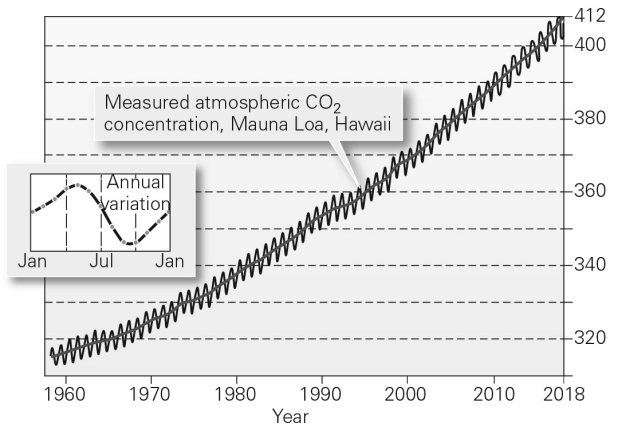
Correct Answer:

Verified
The Keeling Curve shows atmospheric conc...View Answer
Unlock this answer now
Get Access to more Verified Answers free of charge
Correct Answer:
Verified
View Answer
Unlock this answer now
Get Access to more Verified Answers free of charge
Q5: What is a biogeochemical cycle? Provide an
Q34: The end of intense bombardment of the
Q35: In the inset in the figure below,why
Q37: Sedimentary sequences bounded by unconformities that developed
Q39: Which of the following processes releases carbon
Q40: A biogeochemical cycle refers to the _.<br>A)
Q41: The figure below shows parts of the
Q42: As an example of a cyclical global
Q45: The ratio of oxygen-16 and oxygen-18 isotopes
Q59: Toxic chemicals dumped into a river are